
Silage Quality Testing: What the Numbers Actually Mean
A practical guide to reading a forage test report — translating pH, NH₃-N, ME, NDF, ADF, and fermentation acid values into the feeding decisions that actually change what goes in the trough.
The Test Result That Sits in a Drawer Changing Nothing
Australian dairy and beef farmers send more silage samples to forage testing laboratories than ever before — NIR testing is inexpensive (AUD $40 to $75 per sample), fast (24 to 48 hour turnaround from most laboratories), and widely promoted by agronomists, nutritionists, and feed company representatives. The problem is that a significant proportion of test results are received, filed, and not acted on — either because the numbers are unfamiliar, because the producer doesn’t know which numbers matter most for their livestock class, or because the nutritional implications are unclear without the context of a full ration calculation.
This article is a plain-language guide to the numbers that appear on a standard Australian silage forage test report — what each parameter measures, what the acceptable ranges are for different livestock classes, and what specific feeding or ration decisions each result should trigger. The goal is to convert a test result from a document you file to a tool you use.
For the production decisions that determine what quality a silage test result will show before it arrives — including the impact of wrapping quality and fermentation management — our article on the best silage baler setup for high-volume dairy operations covers how production decisions upstream of the test determine what the result can be.
The Core Parameters: What Each Number Measures
1. Dry Matter (DM) — The Starting Point for Everything
DM percentage tells you how much of the bale is actual feed and how much is water. A silage bale at 40% DM (60% moisture) contains 400 kg DM per tonne of fresh weight; a bale at 30% DM (70% moisture) contains 300 kg DM per tonne. All other parameters — ME, CP, NDF — are expressed on a DM basis, so the DM figure is the denominator for all nutritional calculations.
Action trigger: If DM is below 30% (above 70% moisture), the silage was baled too wet and fermentation quality risk is high — check pH and NH₃-N before feeding to sensitive livestock. If DM is above 55% (below 45% moisture), the silage was baled on the dry side and aerobic stability at feedout may be compromised — open bales close to the daily consumption rate.
2. pH — The Primary Fermentation Quality Indicator
pH measures the acidity of the silage. Well-fermented silage produced predominantly by lactic acid bacteria has pH 3.8 to 4.5. Higher pH (4.5 to 5.5) indicates incomplete or compromised fermentation — either because the silage was too dry (above 55% DM) for active fermentation, too wet (below 30% DM) with insufficient WSC, or because the fermentation was dominated by clostridial bacteria producing butyric acid rather than lactic acid.
| pH Range | Fermentation Assessment | Livestock Suitability | Action |
|---|---|---|---|
| 3.8–4.5 | Excellent — lactic acid dominant | All classes — no restriction | Feed normally |
| 4.5–5.0 | Acceptable — minor clostridial activity | All classes with monitoring | Check NH₃-N; limit to non-peak animals if high |
| 5.0–5.5 | Poor — significant clostridial activity | Avoid peak-lactation dairy, late-preg ewes | Check NH₃-N; feed only to dry/maintenance stock |
| >5.5 | Failed fermentation | Do not feed to productive livestock | Discard or compost |
3. Ammonia Nitrogen (NH₃-N) — The Protein Damage Indicator
NH₃-N is expressed as a percentage of total nitrogen in the sample. It measures how much of the silage’s protein nitrogen has been broken down into ammonia — a metabolically useless form for ruminants and a palatability depressant at elevated concentrations. In well-fermented silage, NH₃-N below 8% of total N indicates minimal protein degradation. Above 12%, the silage carries measurable palatability reduction and available protein is significantly below what the crude protein figure suggests.
NH₃-N is the most important single indicator of silage feeding value after pH. A silage with CP of 18% but NH₃-N of 20% has most of its ‘protein’ in ammonia form — effectively unavailable to the animal and causing intake depression that reduces the productivity benefit you would expect from an 18% CP feed.
4. Metabolisable Energy (ME) — The Productivity Driver
ME (MJ/kg DM) is calculated from the digestibility of the silage’s organic matter. It is the most direct measure of how much energy the animal can extract from the silage. High ME silage (10.0 to 11.5 MJ/kg DM) supports high production; medium ME (9.0 to 10.0 MJ/kg DM) supports maintenance to moderate production; low ME (below 8.5 MJ/kg DM) is inadequate for productive livestock and requires energy supplementation from grain or other concentrates.
| ME Range | Suitable For | Grain Supplement Required? | Typical Silage Source |
|---|---|---|---|
| ≥10.5 MJ/kg DM | Peak lactation dairy, growing cattle | Minimal or none | Early-cut ryegrass/lucerne |
| 9.5–10.5 MJ/kg DM | Lactating ewes, growing heifers | Small allocation | Flag-leaf silage, good ferment |
| 9.0–9.5 MJ/kg DM | Dry cows, weaned lambs, maintenance | 0.5–1.0 kg/head/day | Mid-season cut, good ferment |
| <9.0 MJ/kg DM | Dry stock maintenance only | 1.5–2.5 kg/head/day | Late-cut or poor ferment |
5. NDF and ADF — The Fibre Quality Indicators
Neutral Detergent Fibre (NDF) measures the total structural fibre — cell wall material including cellulose, hemicellulose, and lignin. Higher NDF reduces voluntary intake because rumen fill from structural fibre is the primary intake regulator in ruminants. NDF below 50% DM indicates a leafy, digestible silage with high voluntary intake potential; NDF above 65% DM indicates a mature, stemmy material with restricted intake potential.
Acid Detergent Fibre (ADF) measures only the cellulose and lignin fraction — the least digestible components. ADF correlates inversely with digestibility: high ADF = low digestibility. ADF below 30% DM indicates excellent digestibility; ADF above 40% DM indicates poor digestibility regardless of CP or ME values.
Fermentation Acid Profile: The Advanced Test Parameters
Lactic Acid vs. Acetic Acid vs. Butyric Acid — What Each Means
Advanced silage tests from laboratories including Feedtest (Elanco Australia) and Nutrient Advantage report the actual fermentation acid profile — the concentrations of lactic acid, acetic acid, propionic acid, and butyric acid in the silage DM. These parameters are not on standard NIR tests but are available as add-ons at AUD $25 to $45 additional per sample and provide the most detailed picture of fermentation pathway available without a full microbiology analysis.
| Acid | Good Silage Range | Indication if Elevated | Action |
|---|---|---|---|
| Lactic acid | 5–10% DM | Primary fermentation product — dominant in good silage | High is good |
| Acetic acid | 1–3% DM | Heterofermentative LAB or aerobic activity | Above 4%: aerobic stability concern |
| Propionic acid | <0.5% DM | Minor byproduct — normal at low levels | High: unusual, investigate |
| Butyric acid | <0.1% DM | Clostridial fermentation marker | Any detectable level: poor quality batch |
Butyric acid is the key diagnostic parameter for clostridial fermentation. Any detectable butyric acid (above 0.05% DM) in a silage sample indicates that clostridial bacteria were active during fermentation — and that NH₃-N is likely elevated, palatability is reduced, and the batch should be assessed before feeding to peak-productivity livestock.
How to Use Test Results in Practical Feeding Decisions
The Ration Check: Four Questions the Test Result Should Answer
Compare the test ME to the target ME for your stock class. If the silage ME is below target by more than 0.5 MJ/kg DM, calculate the additional grain needed per head per day to close the energy gap. A Holstein cow at peak lactation needs 10.5 MJ/kg DM silage as a minimum for silage to carry the roughage fraction of her ration without large grain allocations.
If CP is adequate (above 14% for dairy) but NH₃-N is above 10%, the available protein is significantly below the headline CP figure. Adjust the protein supplement allocation upward to compensate for ammonia-N that will not be used by the animal. If CP is below target regardless of NH₃-N, add rumen-degradable protein supplement.
For peak-lactation dairy, NDF above 55% starts restricting voluntary intake below the 20 to 24 kg DM/day target. If NDF is high, supplement with a lower-NDF, higher-ME complementary ingredient (grain, distillers grains, beet pulp) to maintain total energy intake without relying on higher roughage volume.
pH above 5.0 restricts the batch to dry/maintenance stock only. pH 4.5 to 5.0 allows all stock classes with monitoring. pH below 4.5 is unrestricted. Use this determination to assign batches to stock pens before feedout begins — not after intake problems emerge.
Frequently Asked Questions
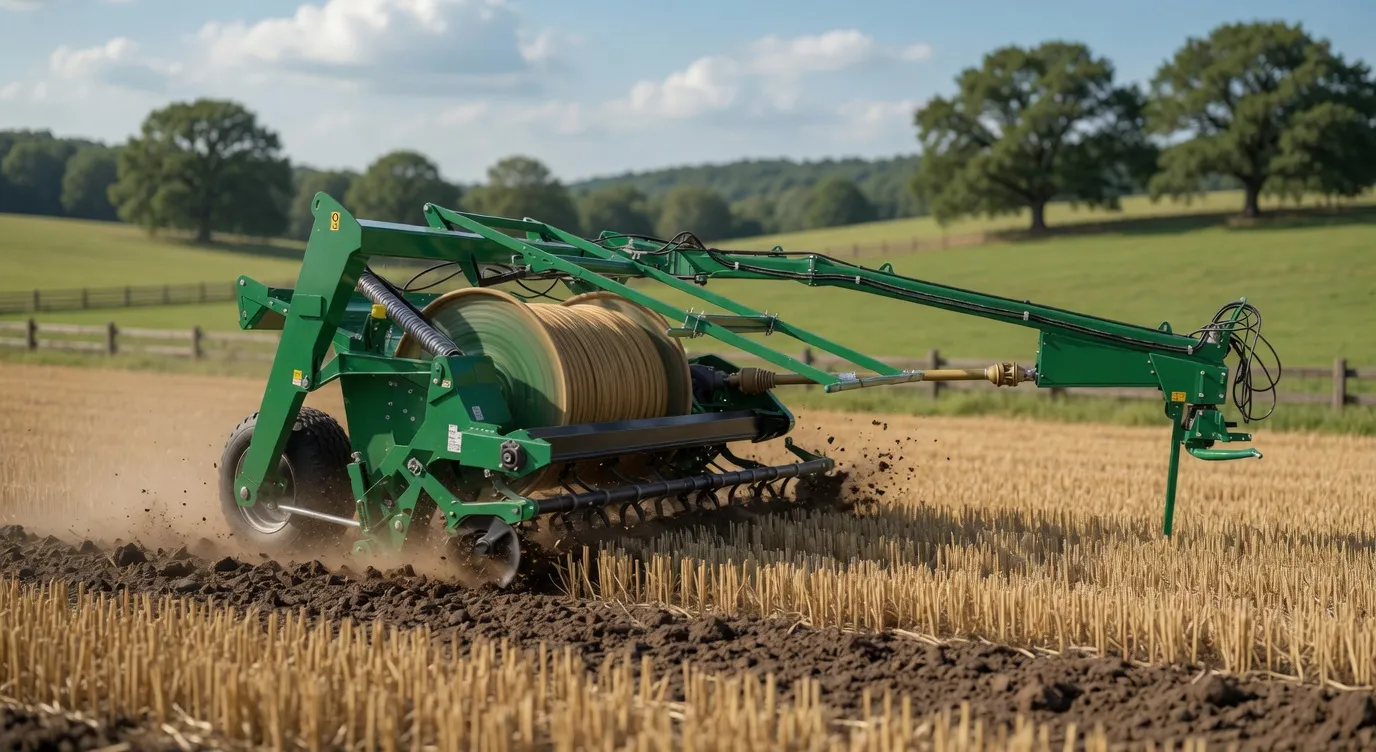
Consistent silage production quality — starting from baling and wrapping — is what gives the forage test result its best possible starting point. The 9YCM-850 bundling film wrapping machine applies a programmable, consistent layer count to every bale — removing the operator counting variation that causes under-wrapped bales whose fermentation the test result will later reflect. Starting from a well-wrapped bale gives the fermentation process its best possible substrate; the forage test simply confirms how well it succeeded.
Discuss Your Silage Quality Targets
Tell us your stock class, production targets, and current test results — we’ll help translate the numbers into the feeding and production decisions that improve your programme.